1. Project Overview
Many goal tracking apps struggle to sustain user engagement and motivation over time. This project aims to develop a progress tracking app that leverages social engagement features such as peer support and milestone sharing to enhance motivation and goal commitment. By integrating social accountability, the app will provide an intuitive and engaging user experience, helping individuals stay committed to their goals.
Problem Statement & Goals
Problem: many goal-tracking apps struggle to sustain user engagement and motivation over time.
User challenge: Many users set goals but struggle to stay motivated due to lack of accountability and engagement.
Opportunity: integrating social features can improve user retention and satisfaction, leading to higher app engagement.
Approach: the project used the Double Diamond design process to examine the problem and develop a digital product.
2. Research & Insights
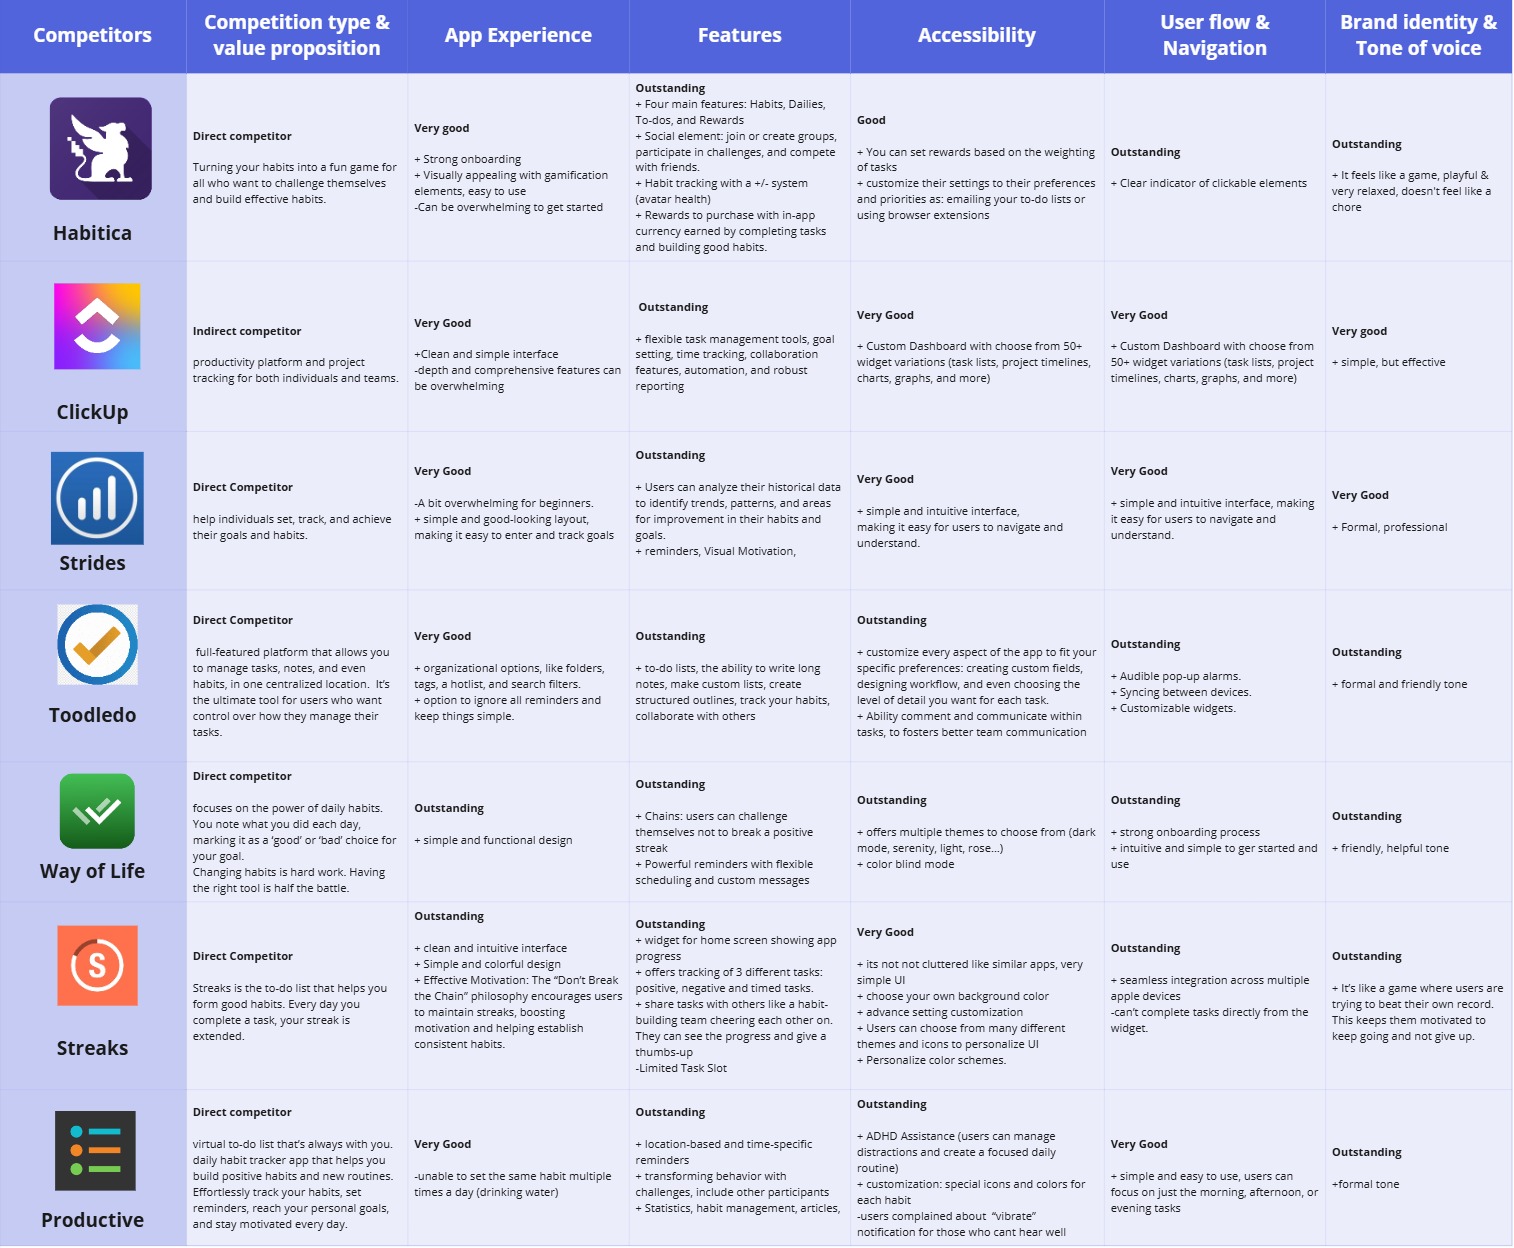
Competitor Analysis
Analyzed 7 apps: ranging from habit building, project management, productivity tracking and goal tracking.
- Most use data analysis and data representation.
- Some use gamification and/or social elements.
- Most have strong onboarding process.
- Most are overwhelming to use at first.
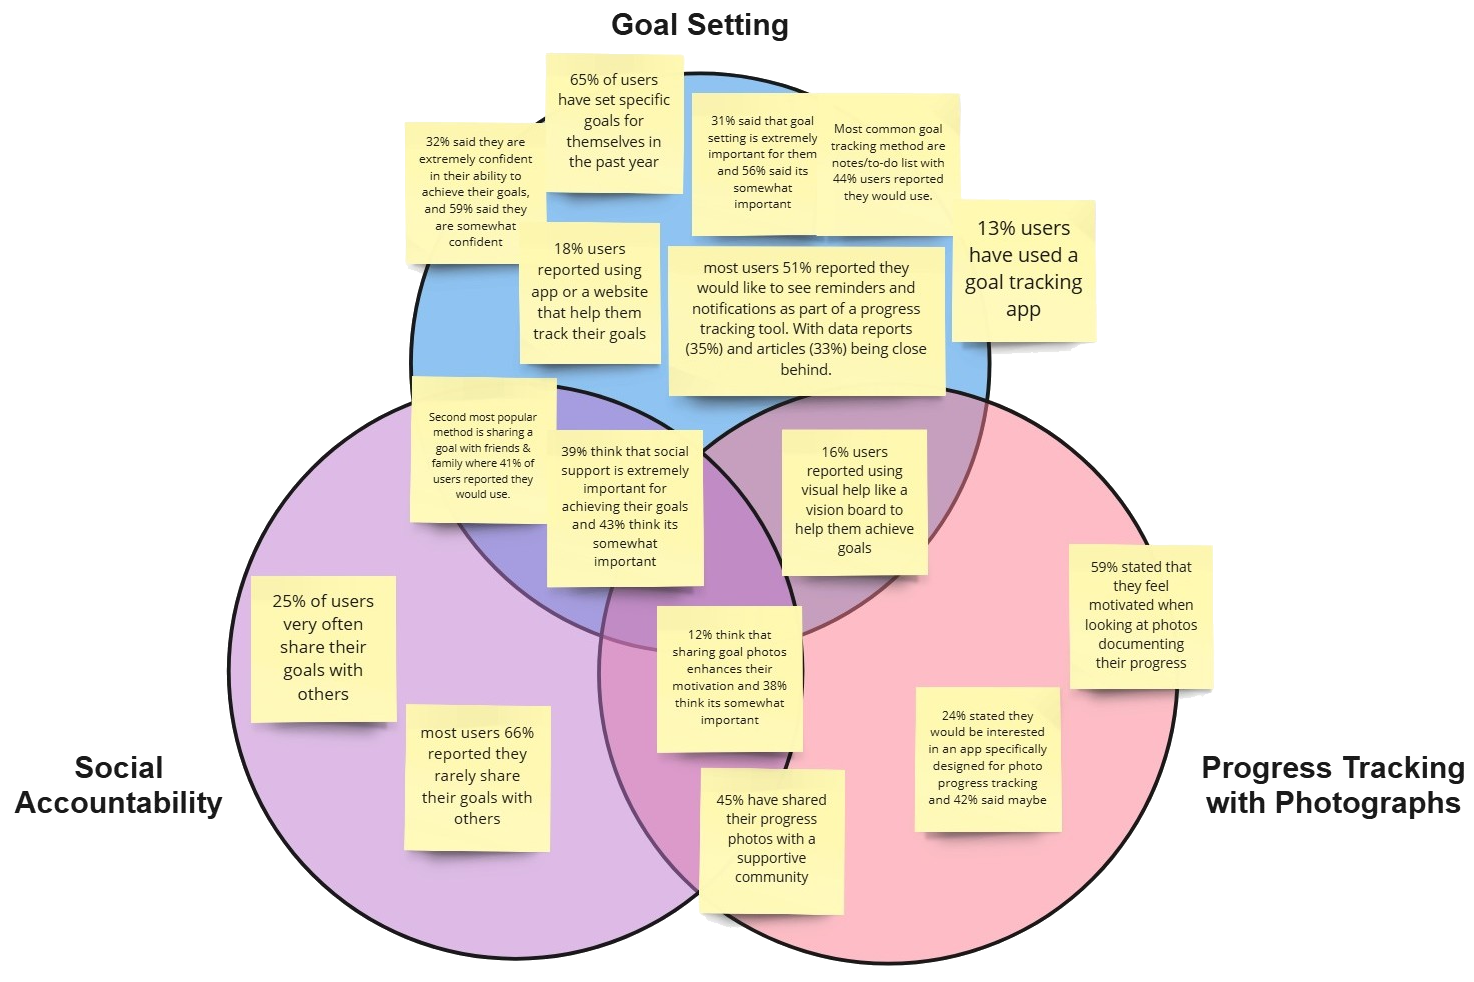
Online Survey (83 Responses):
- Goal setting & tracking: 65% of users have set specific goals in the past year. The most popular tracking method is notes/to-do lists (44%), followed by sharing goals with friends and family (41%).
- Social support: 39% find it extremely important to share their goals with others, and 43% consider it somewhat important.
- Progress tracking with photos: 45% of individuals share personal progress photos on social media or with a supportive community, while 59% feel motivated when reviewing their past progress through photographs.
Survey Data Analysis
I gathered and analysed survey insights through a card sorting exercise. In this exercise, the most crucial data was categorized into three themes: goal setting, social accountability, and progress tracking with photos.
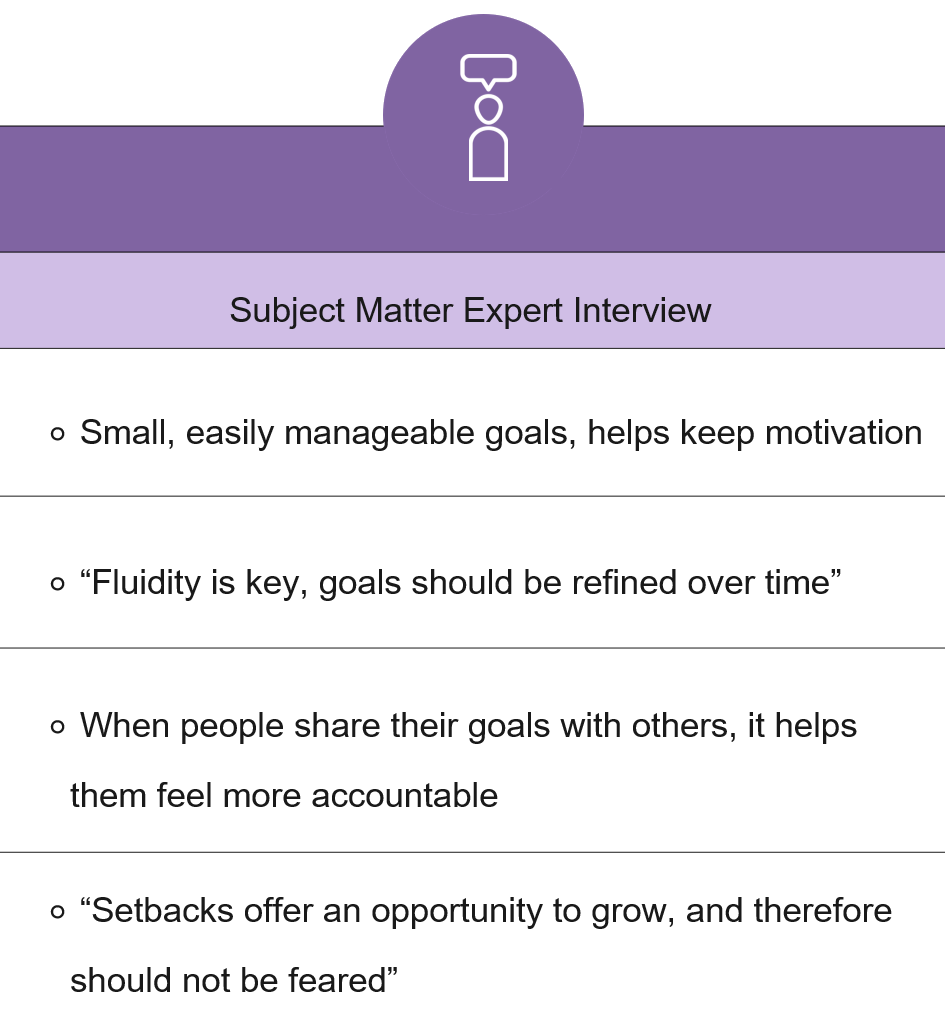
SME Interview:
The participant was a business mentor and a life coach, with sixteen years of experience in the field. The findings provided valuable insights into the potential benefits, challenges, and recommendations for designing a progress tracking application.
Quote: "Fluity is key and goals should be refind over time"
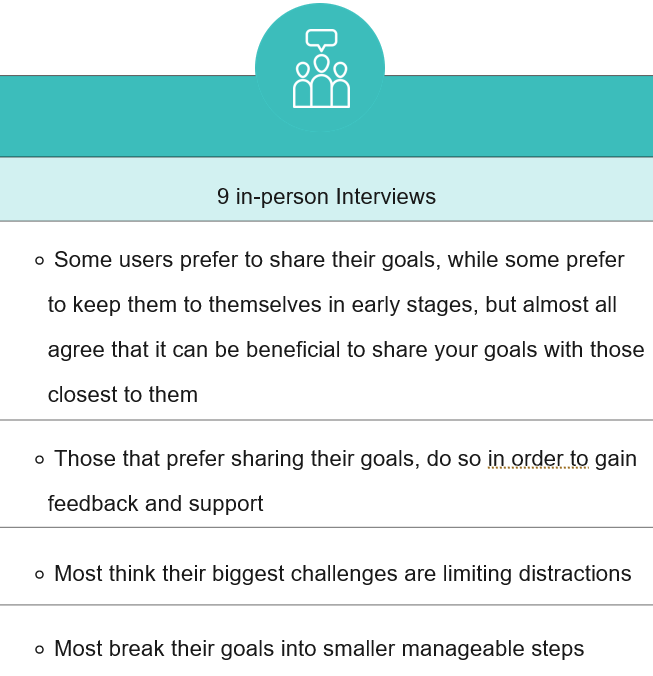
User Interviews (9 Participants):
I conducted one-to-one interviews with target users to gain insight and gather valuable qualitative research on how individuals set and achieve personal goals.
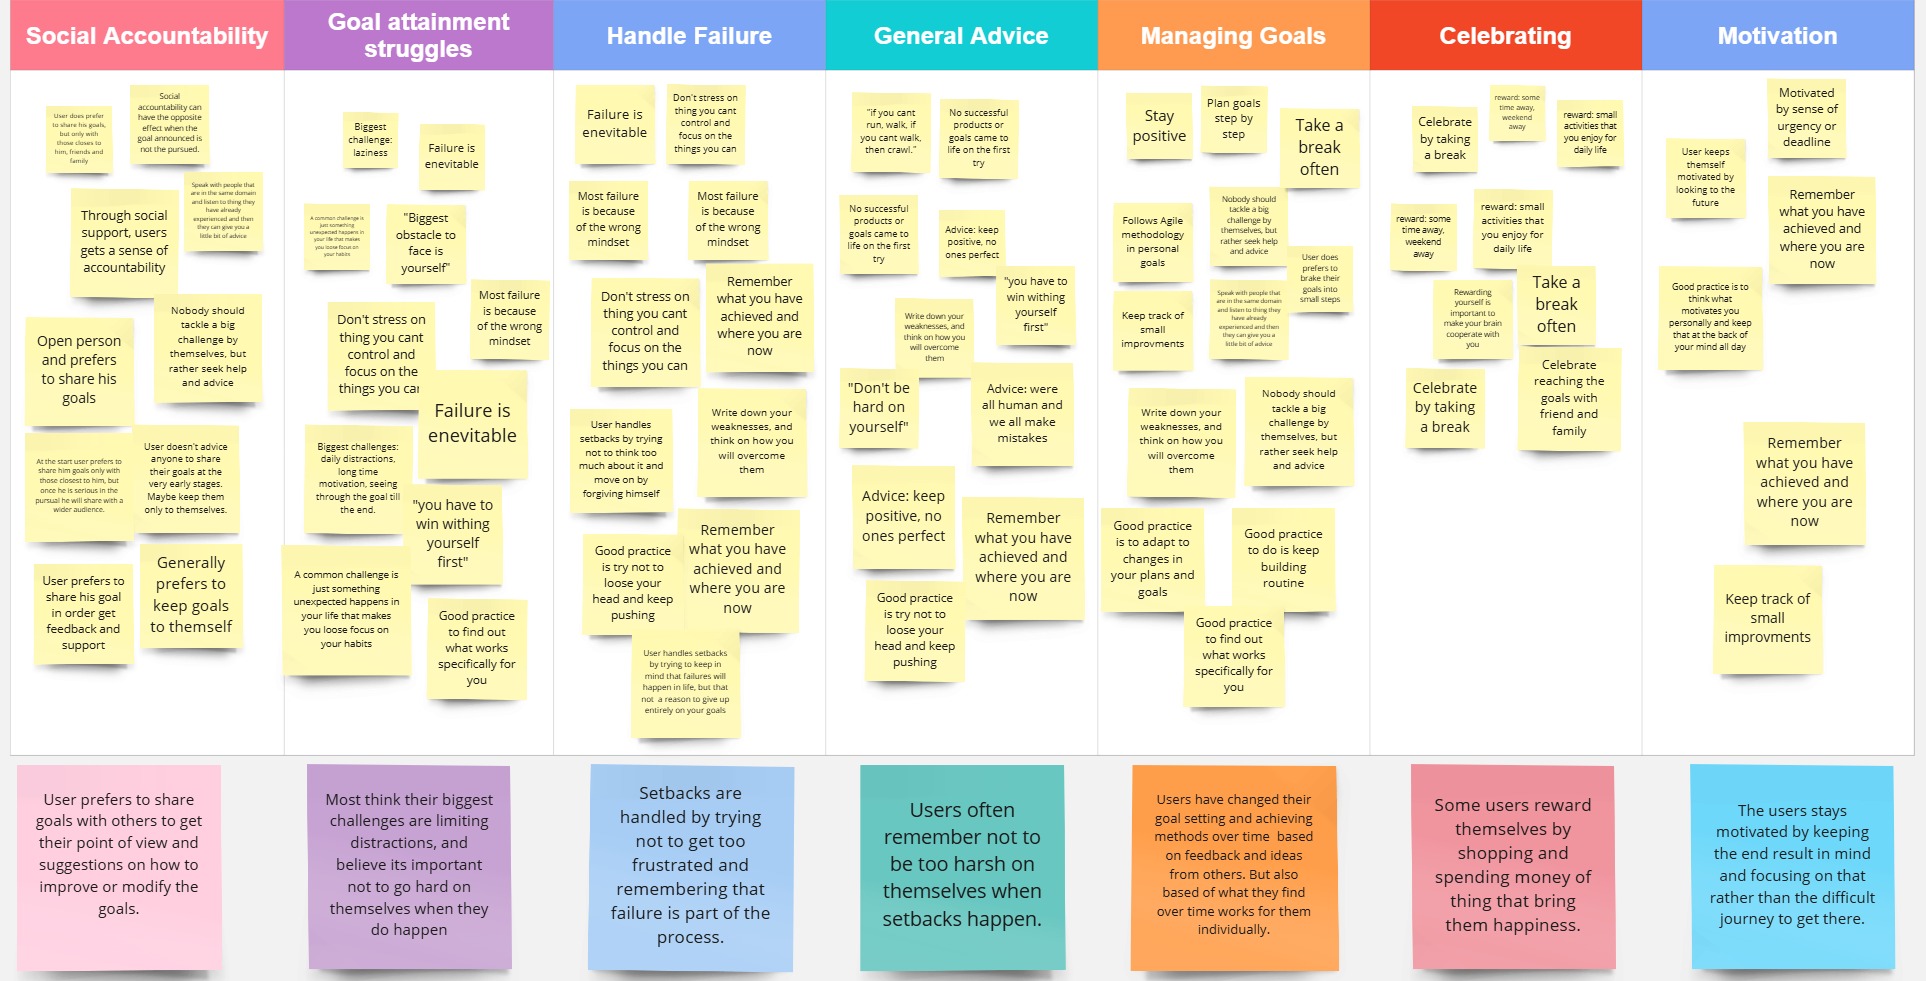
Interviews Data Analysis
Each interview was analyzed to extract key observations. Using thematic analysis, I identified patterns in the data to uncover meaningful insights and draw conclusions. The findings were organized into categories such as accountability, struggles, failure, general advice, goal management, celebration, and motivation.
3. Define
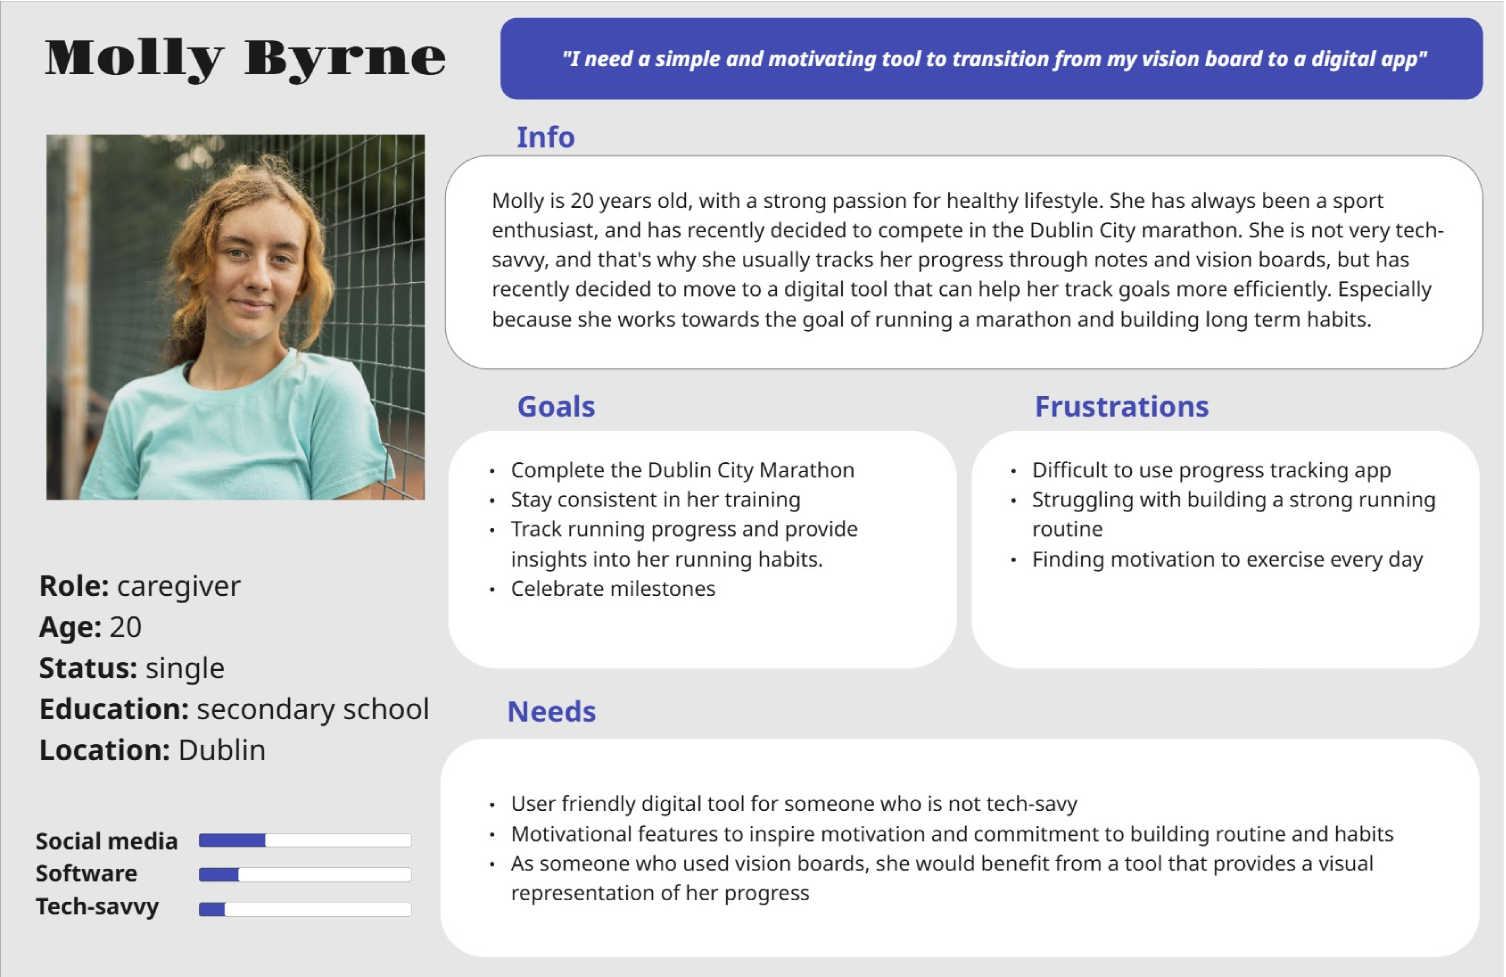
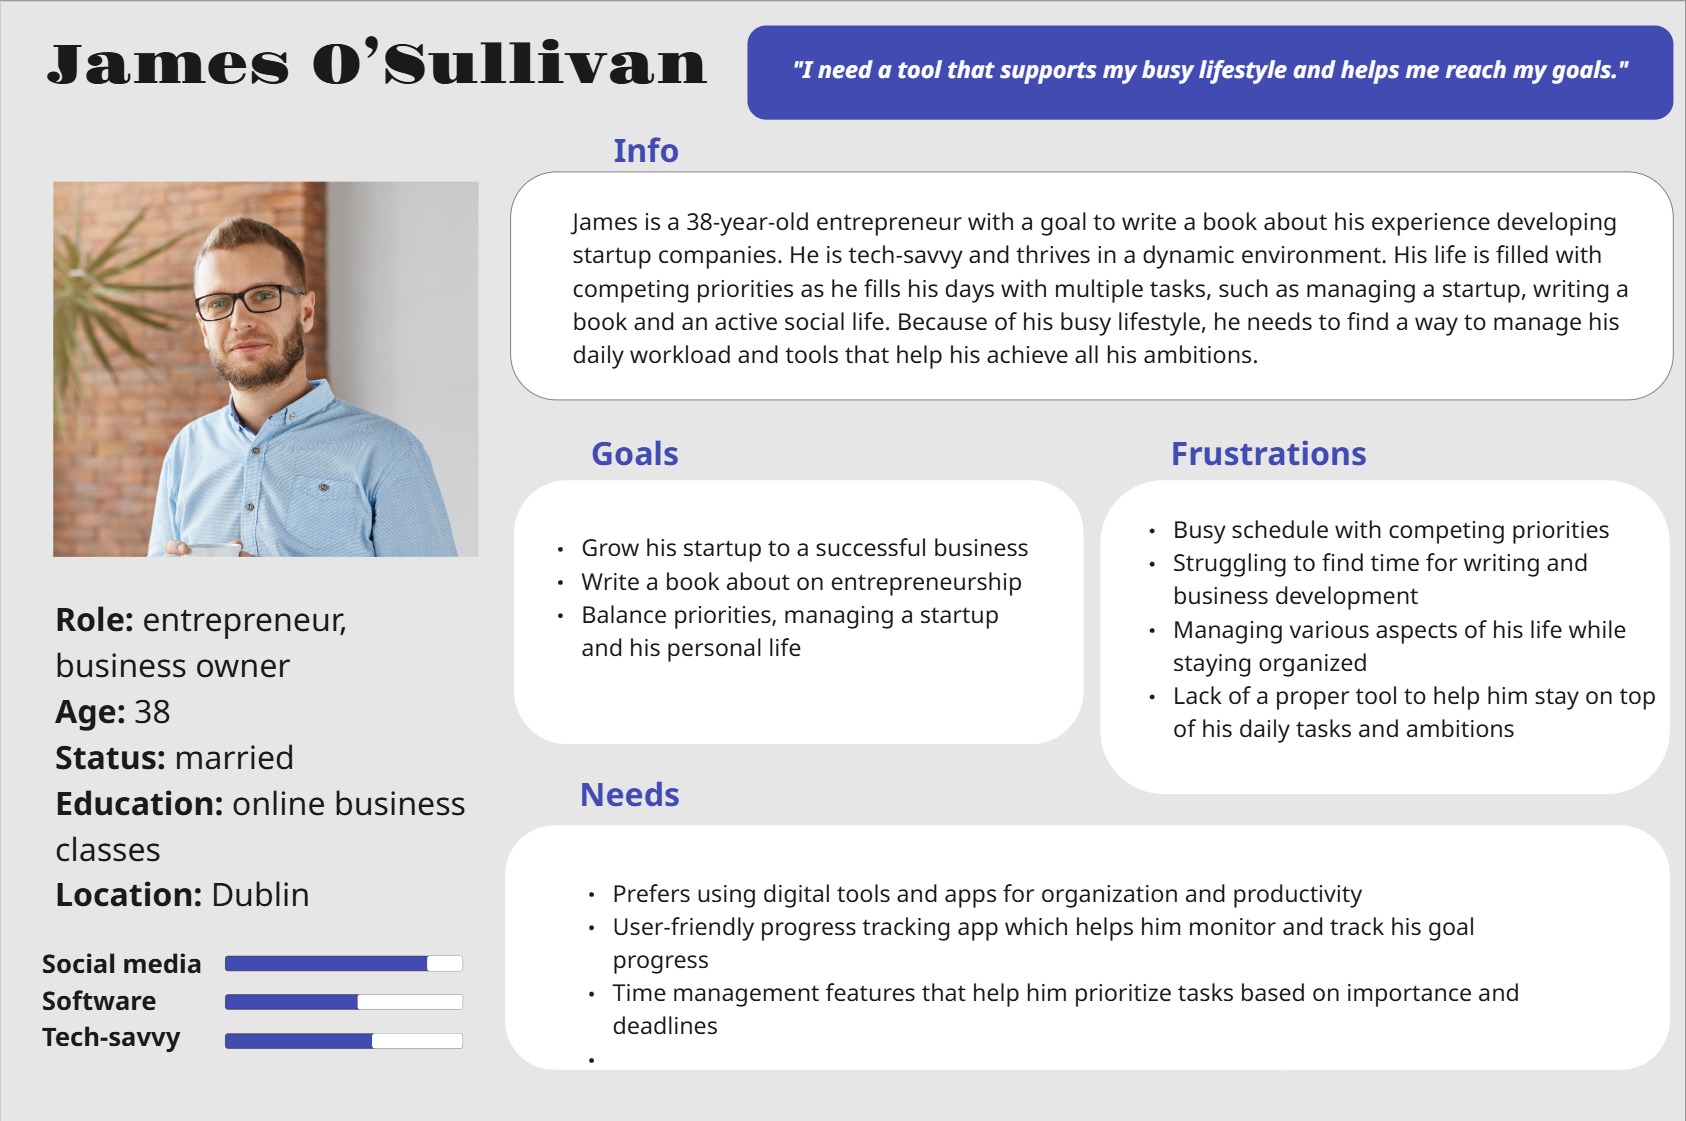
Personas
The data collected from user interviews and surveys was key in defining the target audience and shaping user personas. To gain deeper insights into user characteristics, needs, experiences, and behaviors, I developed two distinct personas.
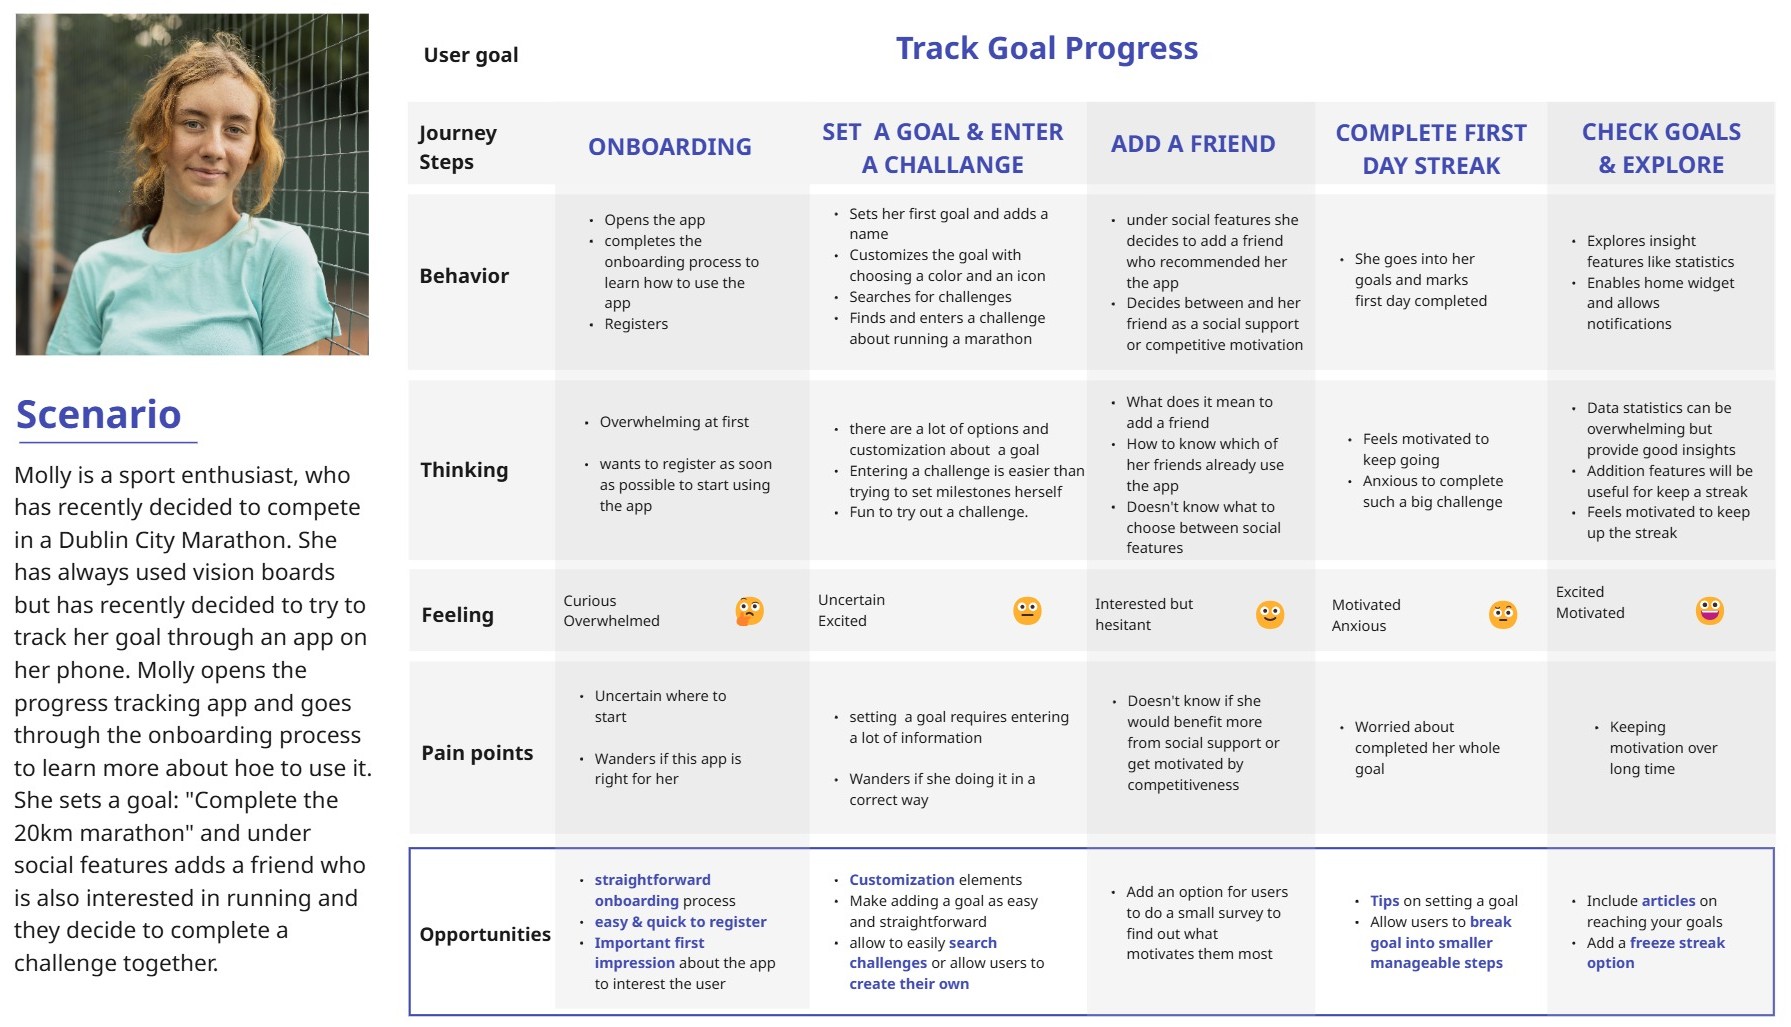
Scenario & a Journey Map
Pain points: unsure where to start, wanders if this app is right for her, setting a goal requires entering a lot of information, indesicisve if she should do the challenge alone or with a friend, worried about not completing her goals, worried about staying motivated.
Opportunities: strong onboarding process, allow customization, make adding a new goal easy and straighforward, allow to easily search challenges or allow users to create their own, break goals into more managable steps, include articles and tips on setting goals, add gamififcation elements to motivate users, add a freeze streak option.
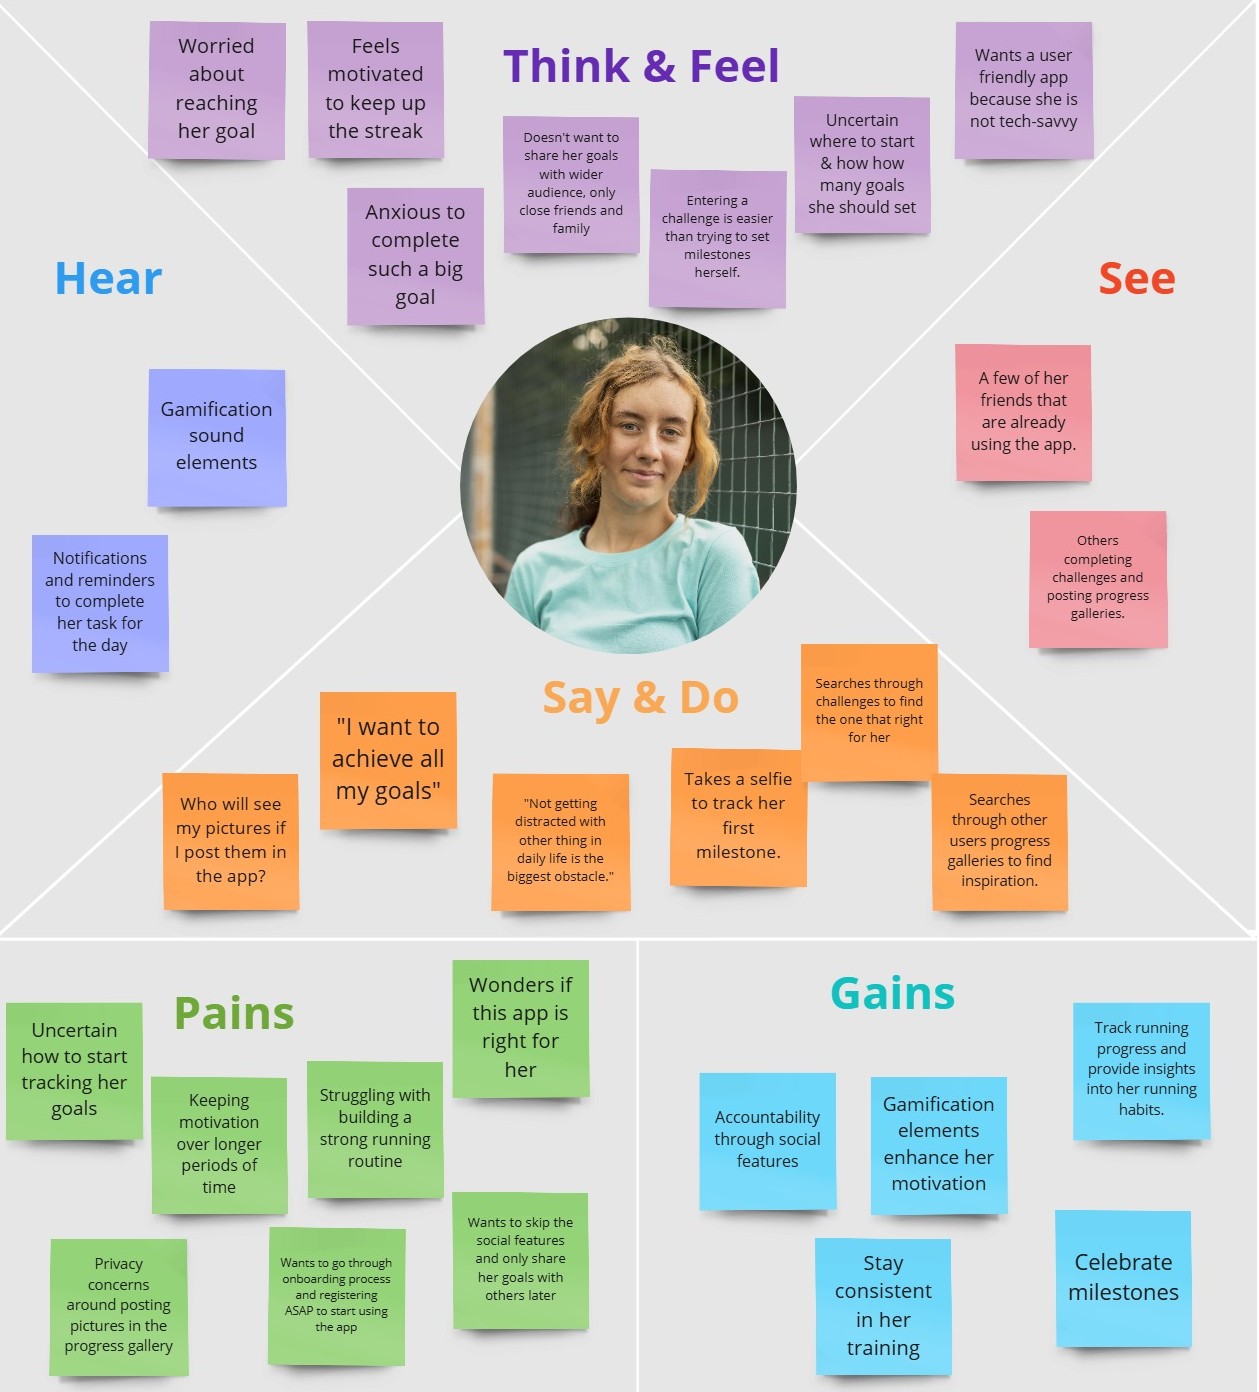
Empathy Map
I created an empathy map to represent user attitudes and behaviors, providing insight into what drives their actions. It also helps uncover overlooked needs from the initial research.
Pain points: unsure how to start tracking goals, struggles to build a routine, unsure if the app is right for her, and has trouble staying motivated long-term.
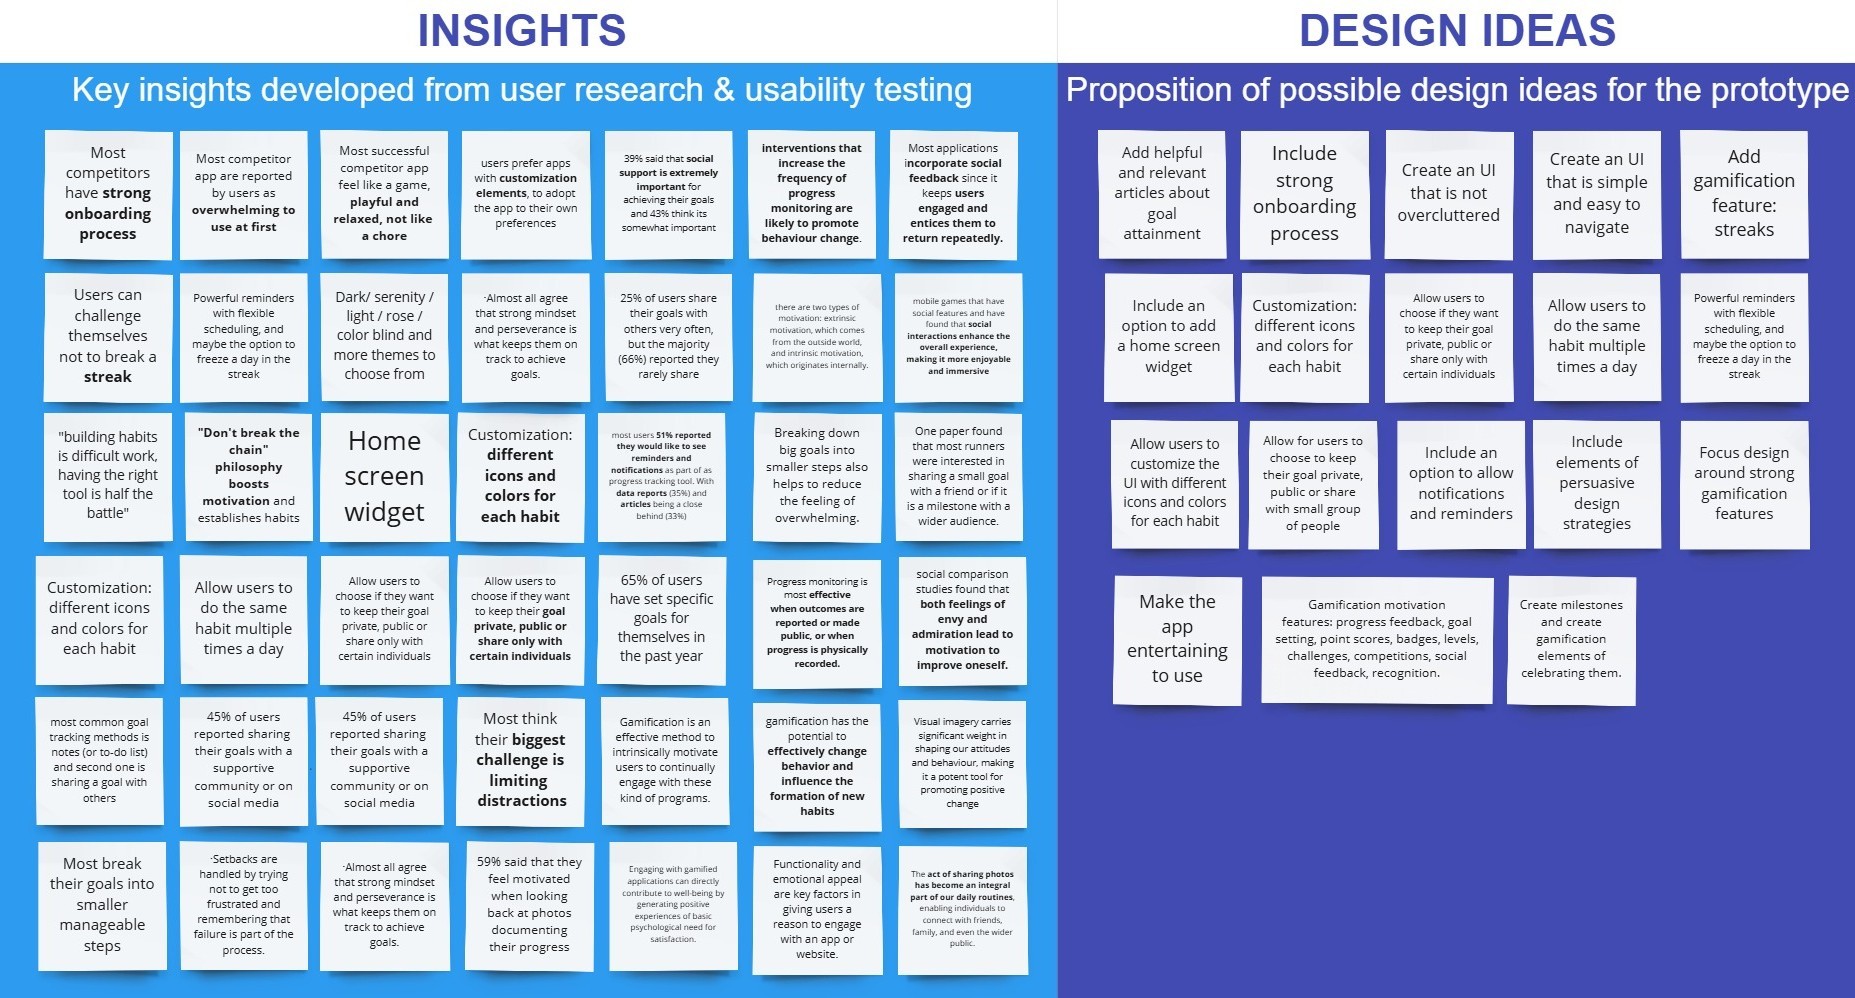
4. Ideation & Design Process
Key Design Ideas
- Strong onboarding: ensure a smooth user introduction to the platform.
- Progress tracking: break goals into small steps and celebrate milestones.
- Gamification: make goal tracking engaging and enjoyable.
- Intuitive UI: keep the design clean and user-friendly to prevent overwhelming users.
- Social features with privacy control: allow users to share progress selectively or keep it private.
- Notifications & reminders: keep users engaged with timely prompts.
- Helpful resources: provide articles and guides to support users.
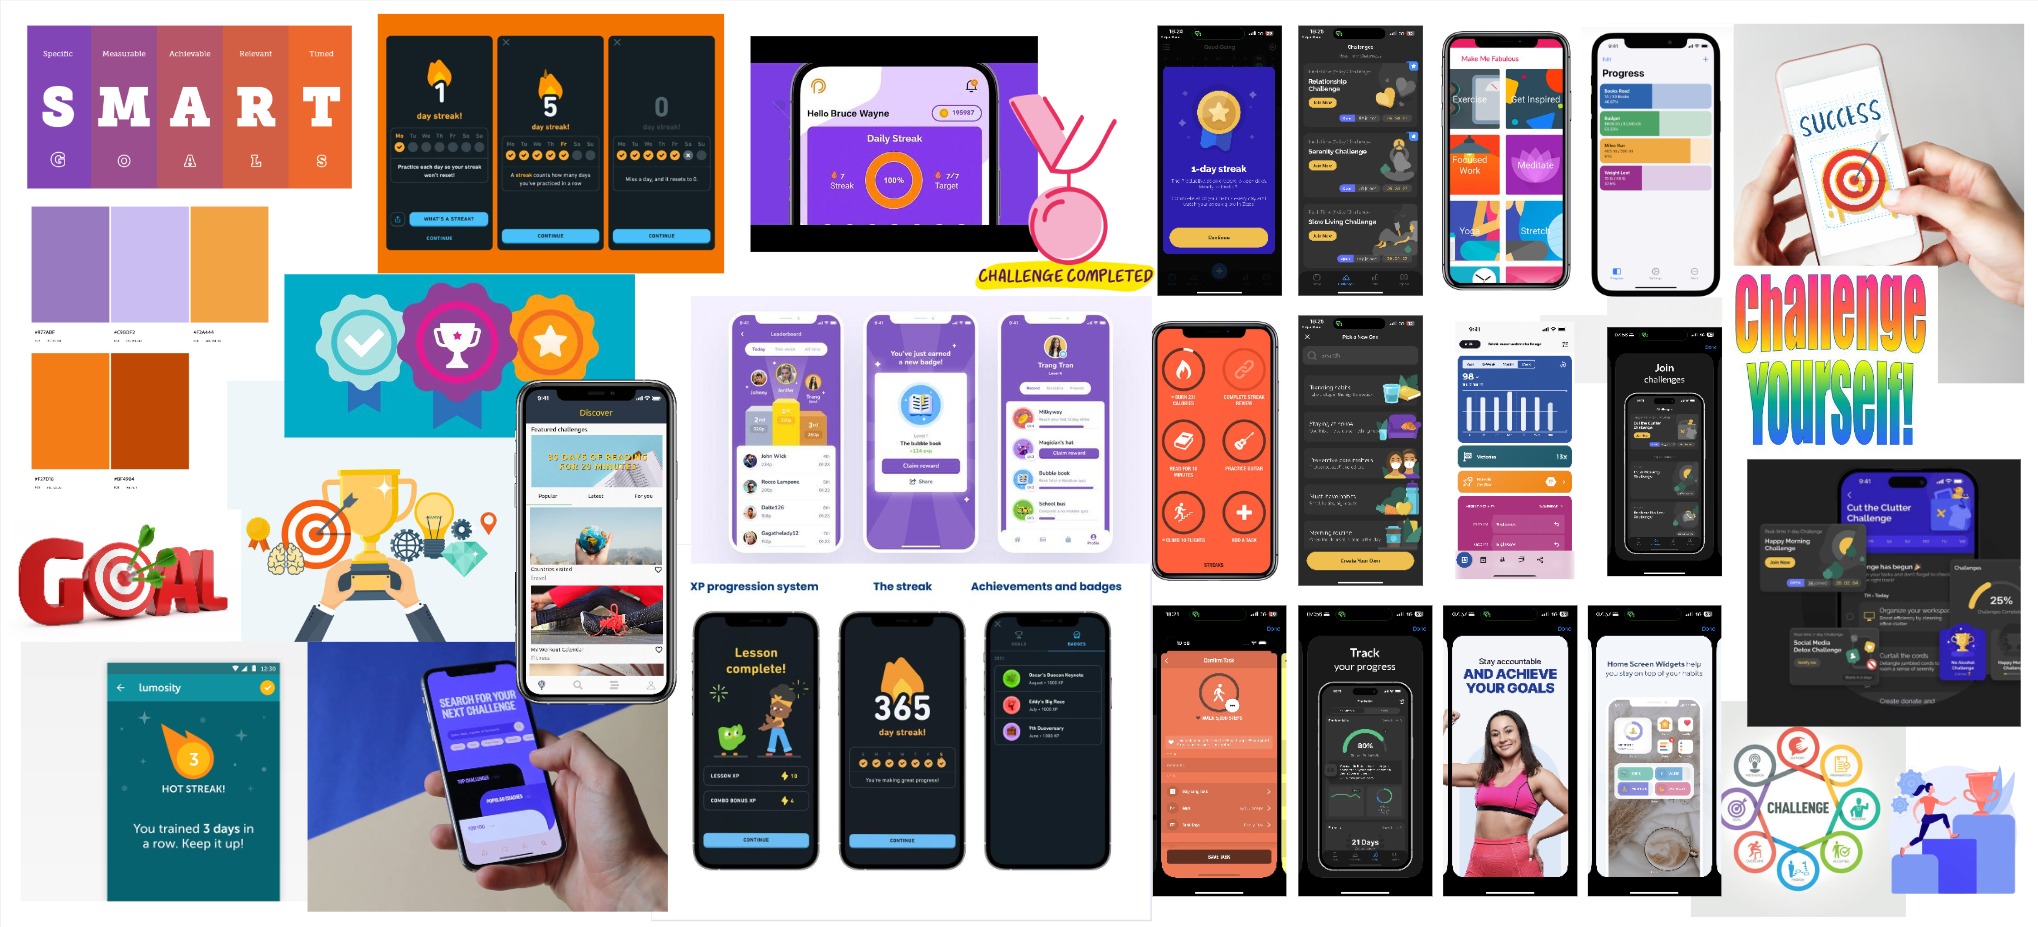
Design Strategy
I researched different goal setting and gamification platforms to create a project mood board, in addition to a proposal of a typography and colour palette to guide the design process.
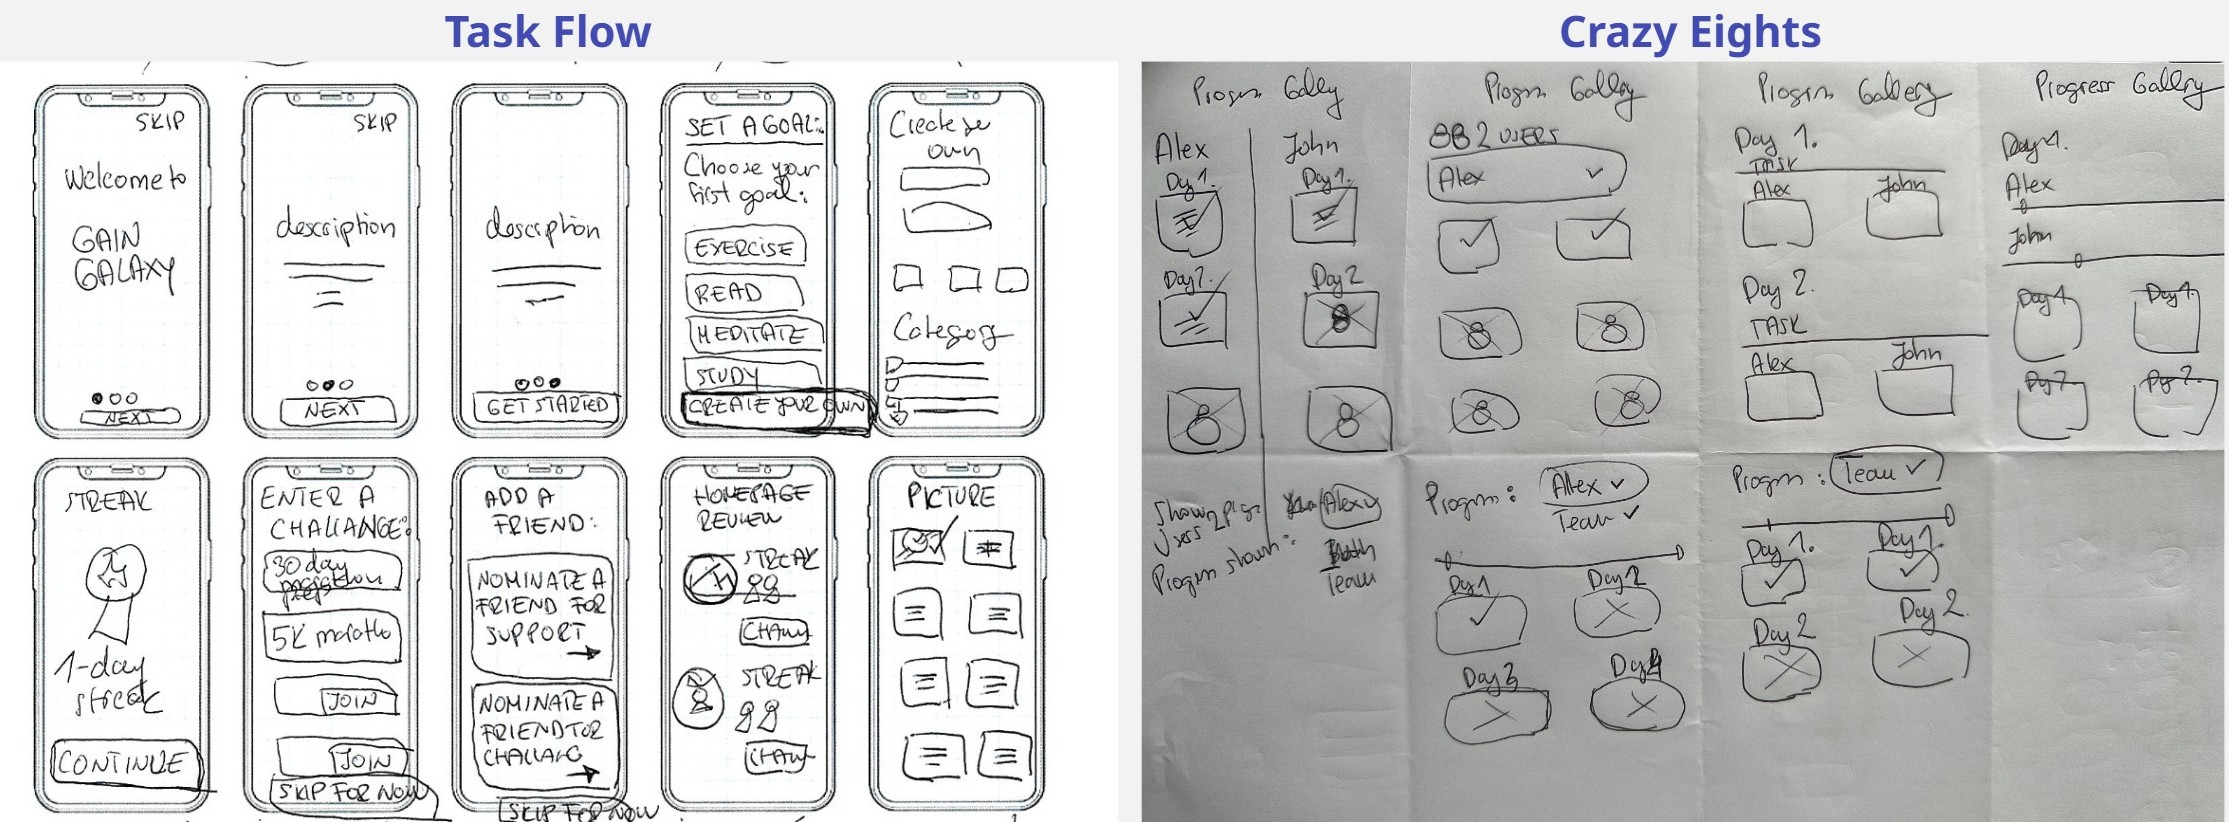
Paper Prototypes
Using paper prototyping, I developed early concepts of the app and defined user flows, breaking the journey into key tasks: setting a goal, joining a challenge, sharing progress, and creating a tracking gallery. These sketches allowed me to experiment with layouts and design elements to identify the best solutions.
5. Usability Testing & Iteration
Testing Approach
- Pilot + two rounds of usability testing.
- 12 participants in total tested each prototype.
- Method: A/B Prototype, within-subjects (repeated-measures).
- Metrics: task success rate, user satisfaction (SUS Scale), and motivation levels (IMI Scale).
Two prototypes were developed:
- Prototype A has no social features. Users set goals, join challenges, and track progress with photos or notes.
- Prototype B includes social features. Users can invite others to challenges and view each other’s progress.
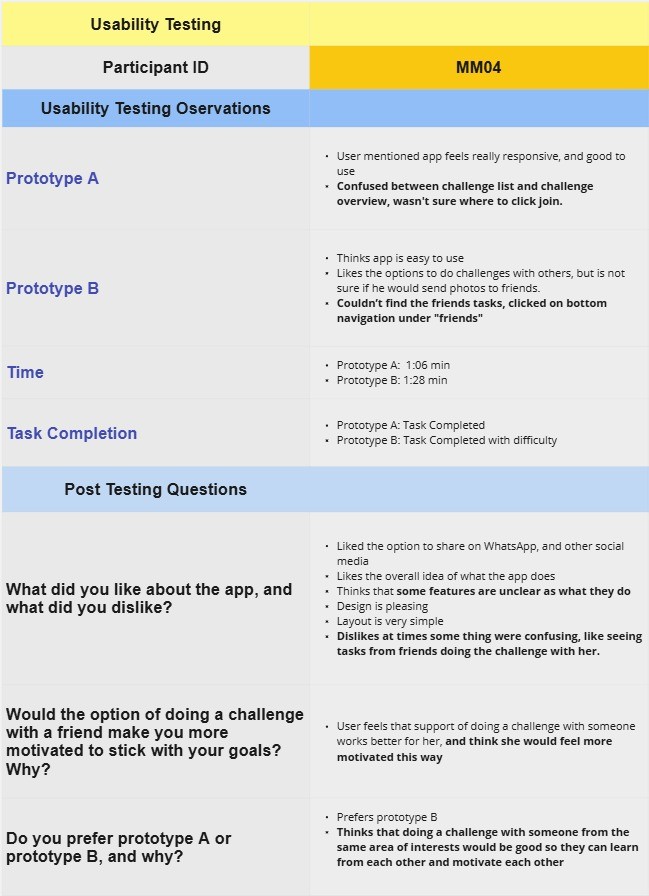
Testing (12 Participants):
- Task completion was 100% successful for prototype A, and 85% for prototype B.
- Quantitative data collected: task success rate, time on task, SUS usability scale, IMI scale.
- Qualitative data collected: post testing interview.
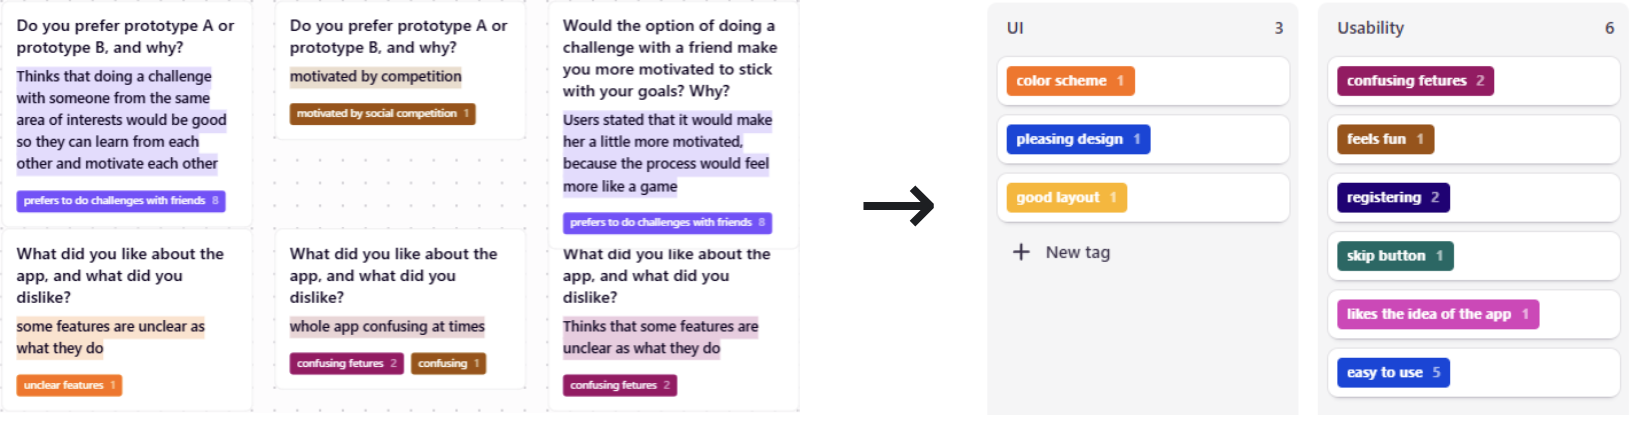
Testing Data Analysis
I imported the interview data into Dovetail for thematic analysis. I reviewed responses, tagged key phrases with themes, and extracted insights from the finalized tags. All six participants said Prototype B would boost motivation but found its interface more complex, reducing satisfaction. As a result, they preferred Prototype A for its simplicity. One user reinforced this, stating that while Prototype B’s features were motivating, Prototype A’s ease of use made it the better choice.
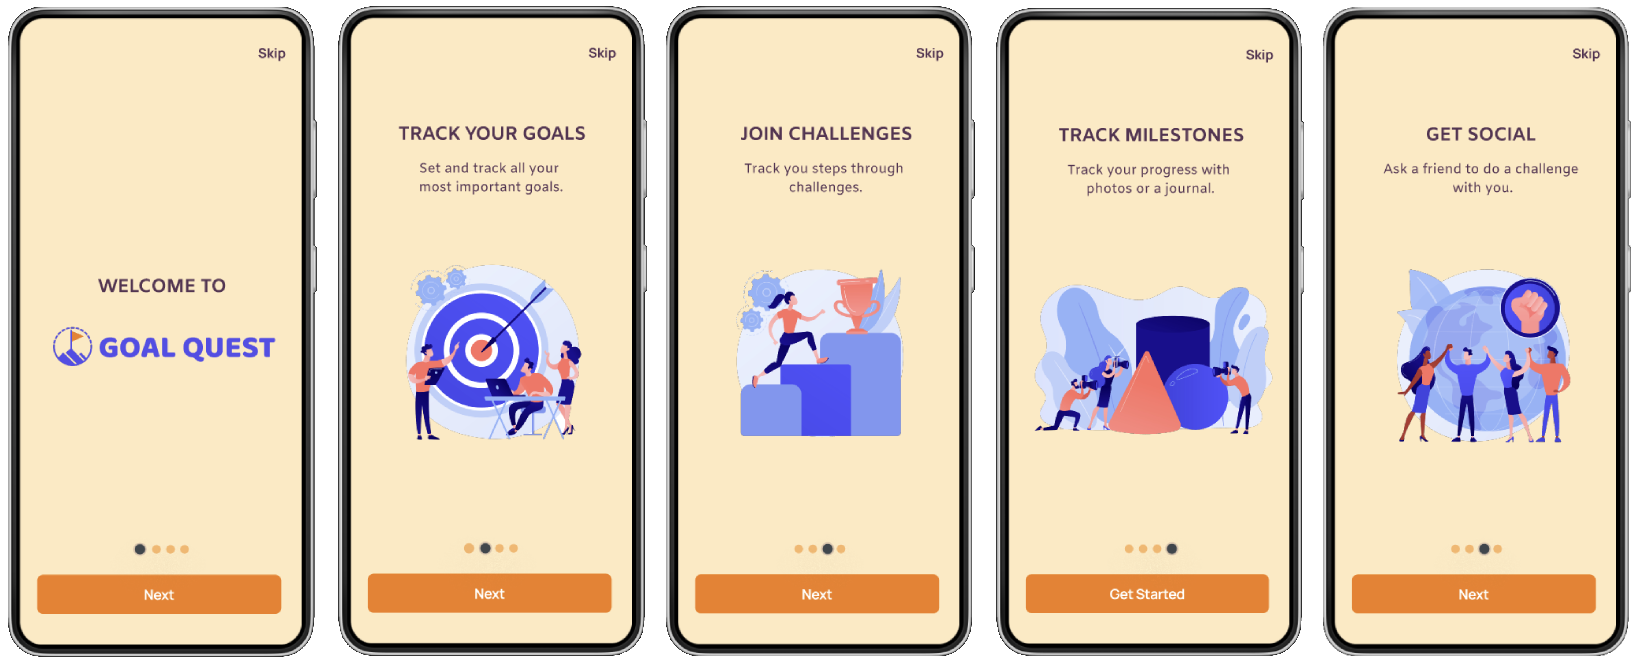
6. Final Product
Onboarding Process
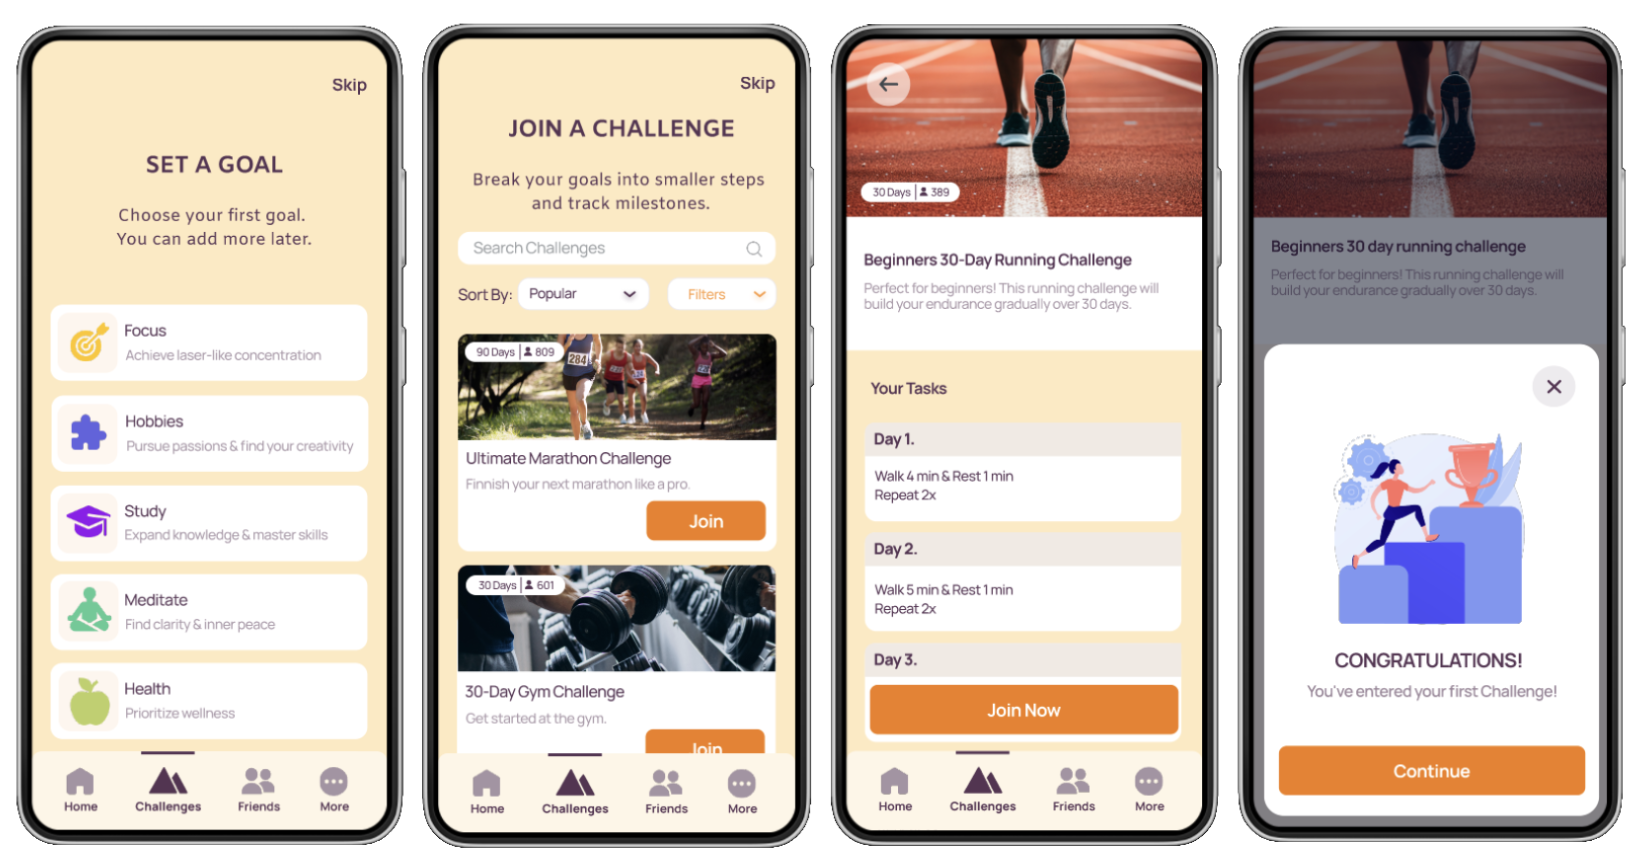
Set a Goal & Join a Challenge
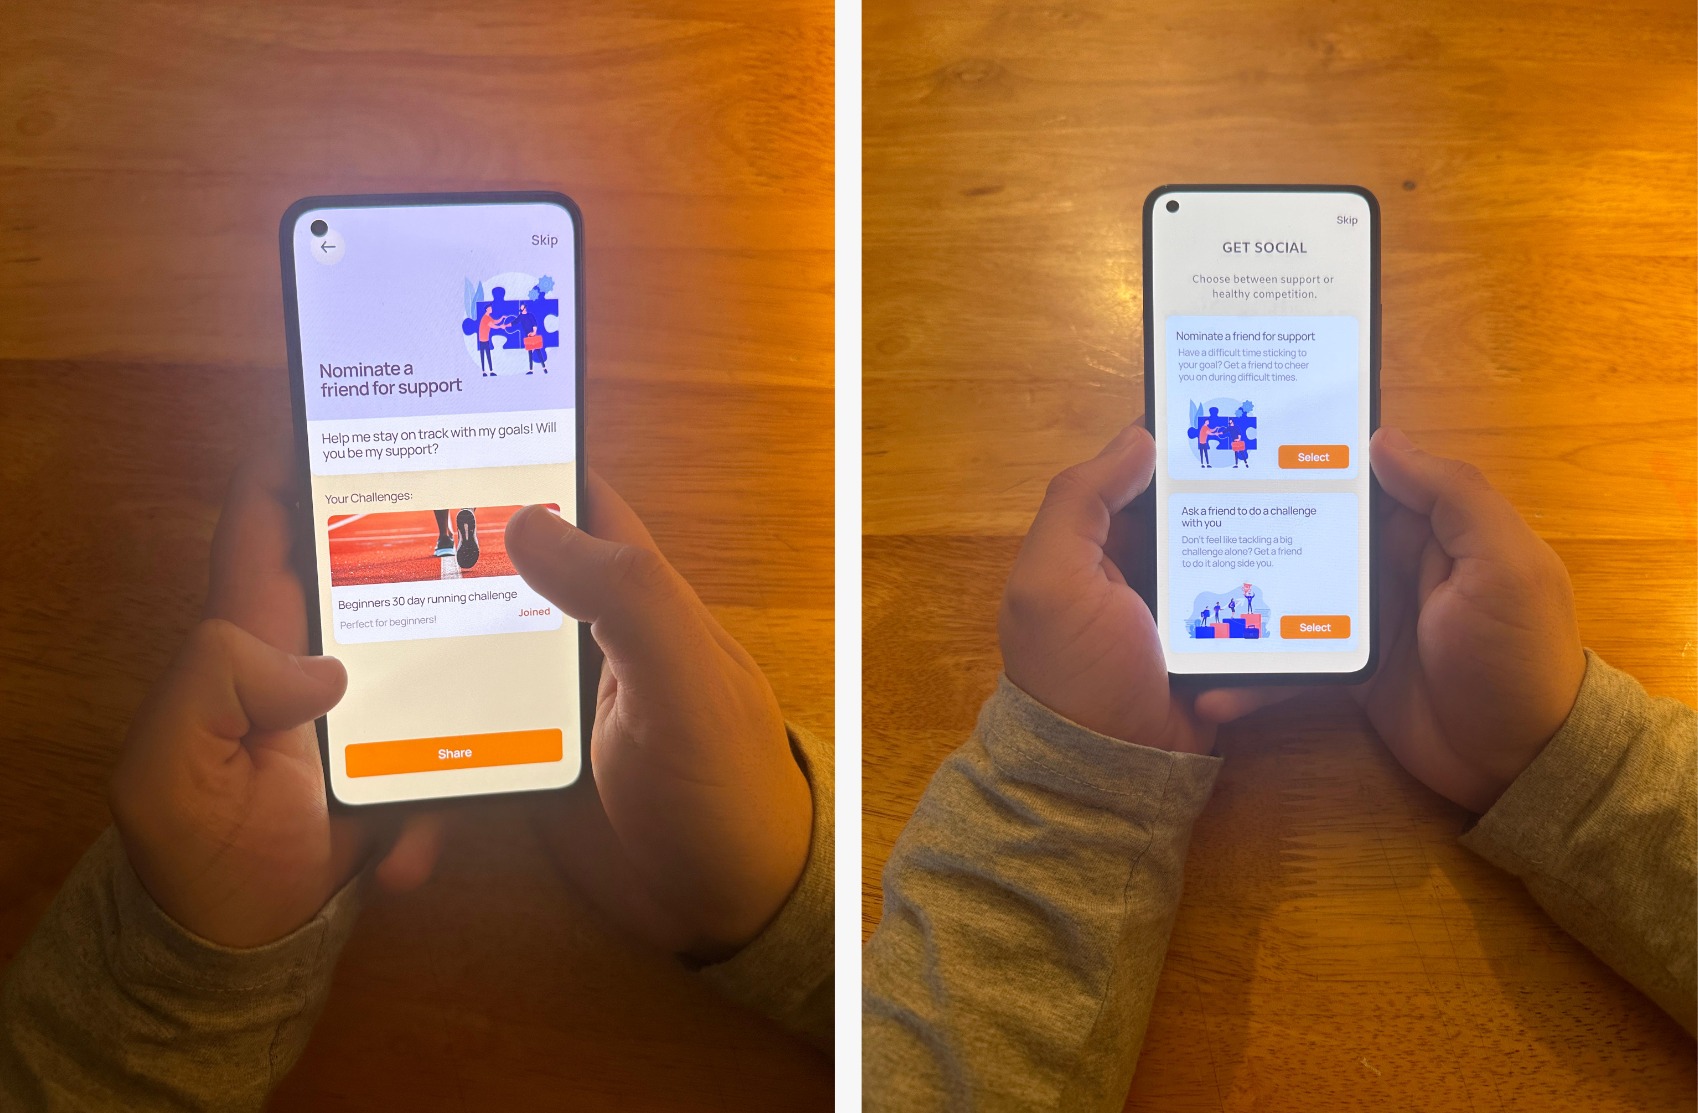
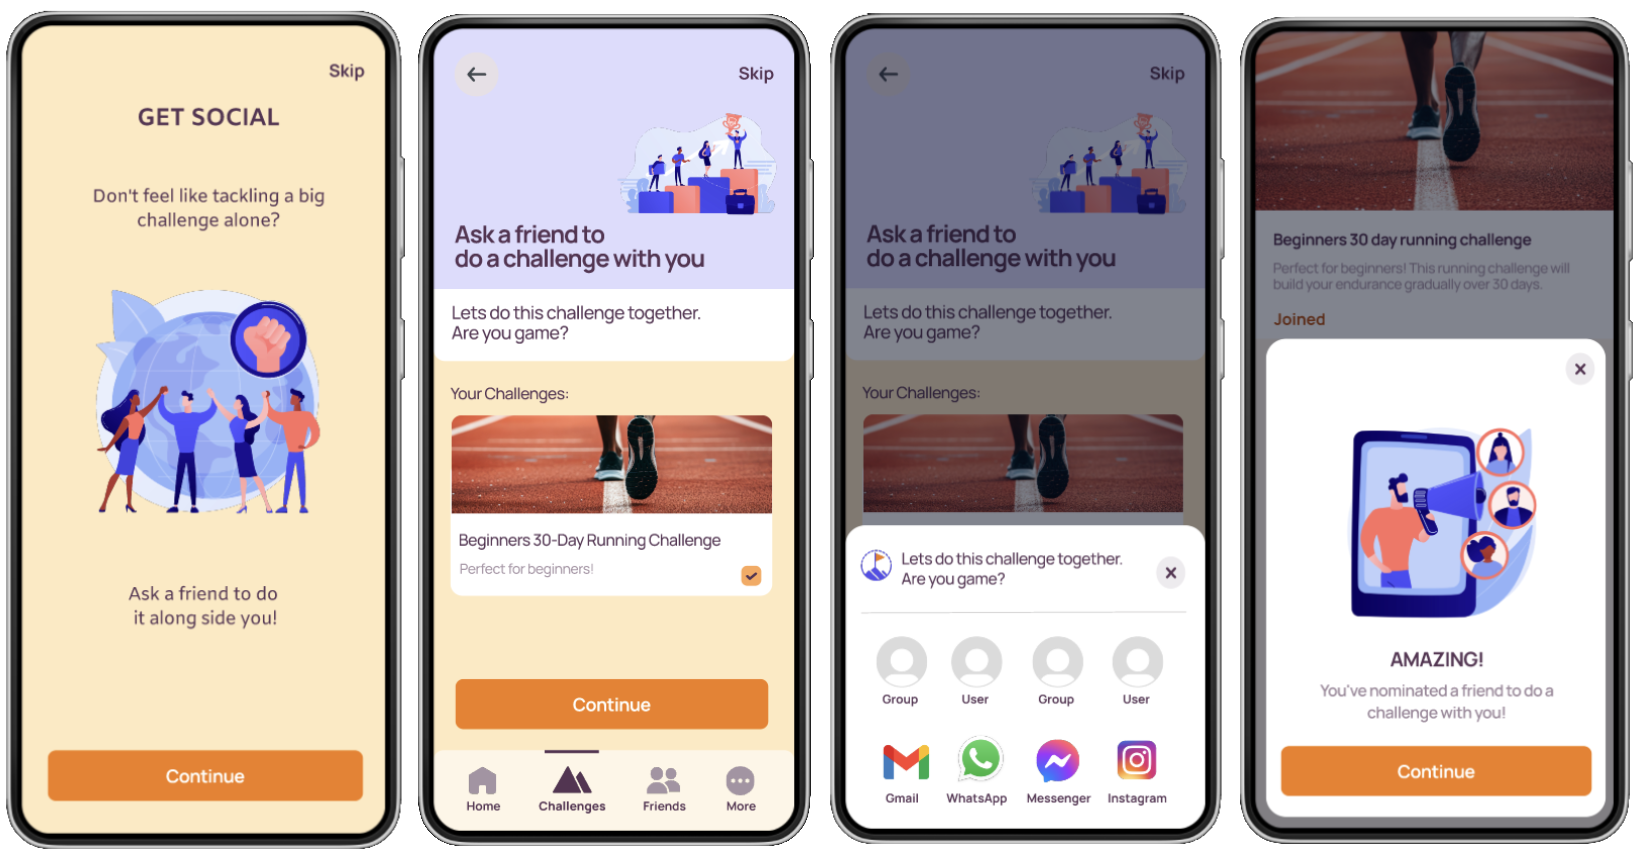
Social Features
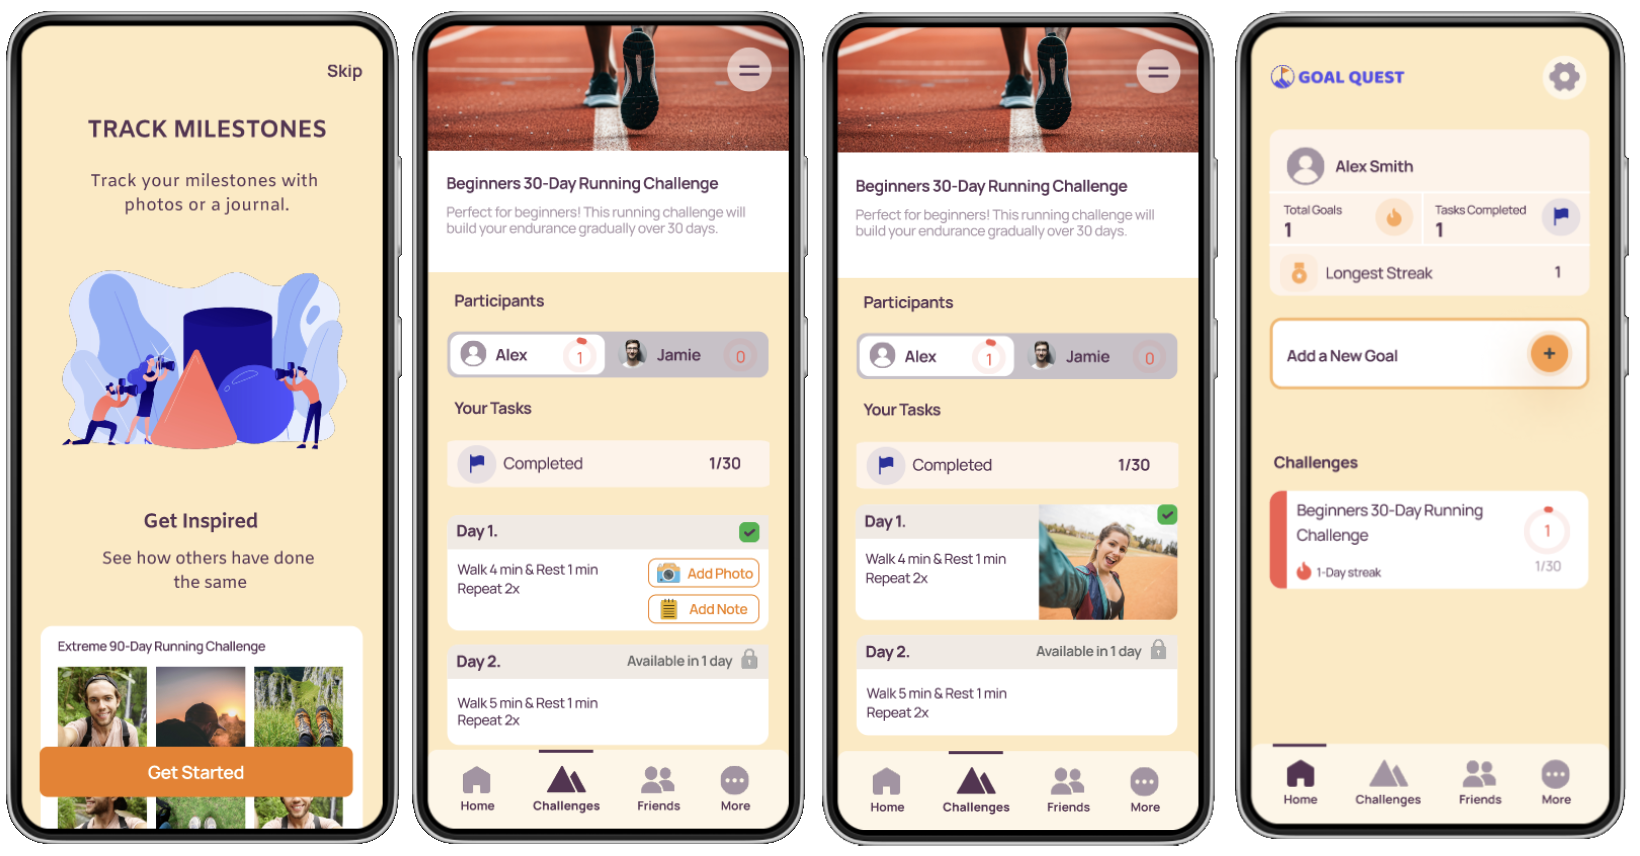
Complete a Task and Add a Photo
7. Takeaways
Quantitative analysis indicated that social features in progress-tracking apps did not enhance user engagement or motivation. However, qualitative data contradicted this. Participants believed that prototype B’s social features would boost motivation compared to prototype A. The issue was that these features made the UI more complex, reducing user satisfaction. As a result, users preferred prototype A for its simplicity and ease of use. One participant confirmed this, stating that while social features increased motivation, they still preferred prototype A for its usability.